The Courtside View at Early-Season Invitationals
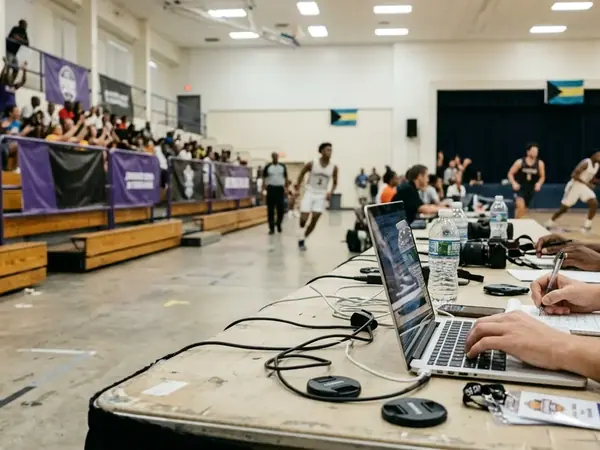
The scene courtside at an early-season women's invitational reveals a distinct divide in how the game is consumed. A fast break finishes with a contested layup, sending a roar through the crowd. The spectators immediately look up at the scoreboard to see the point total change. The professional scout sitting on the baseline lets the play finish without glancing at the rafters. They look down at their tablet to read the live stat feed. The scout needs to know whether that specific break added a possession, which player secured the defensive board that initiated the sequence, and which five athletes are currently sharing the floor.
Points function as a lagging indicator. They simply restate the basket the building already witnessed. The true narrative of a basketball game emerges through possession counts, rebounding margins, and lineup efficiency. Regulation play consists of four 10-minute quarters, totaling 40 minutes of action. A single fast break is priced against a 10-minute period rather than a 20-minute half. Each live possession is governed by a 30-second shot clock. The tablet check is timed precisely to the break itself, occurring before the subsequent inbound pass happens.
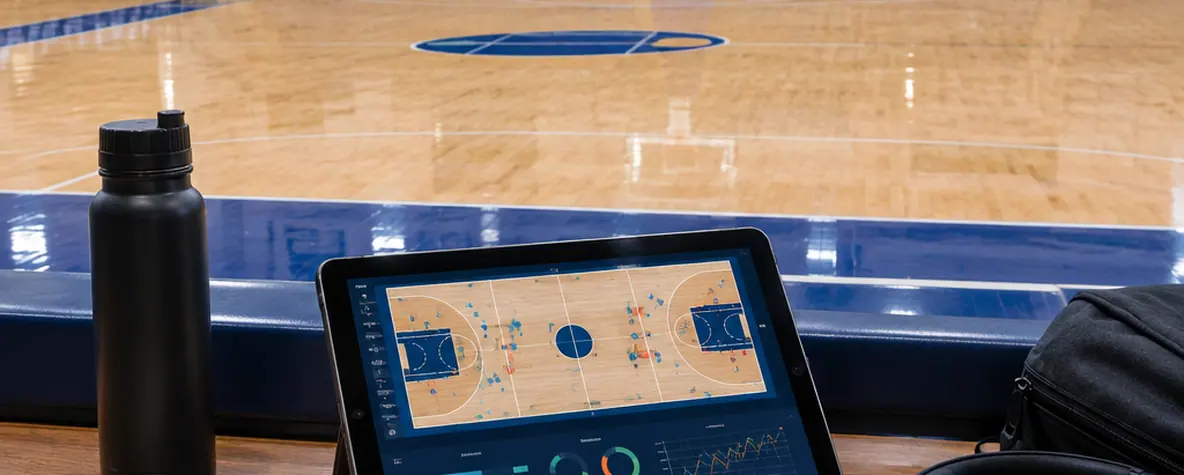
Standard box scores highlight who is scoring. Advanced live stat tracking reveals how a team controls the floor. The Junkanoo Jam data feed provides a granular look at these underlying mechanics. Analysts rely on this continuous stream of play-by-play data to evaluate team performance beyond the raw point totals.
Quantifying Tempo and Offensive Efficiency
Calculating the exact number of possessions requires a specific formula. The standard possession estimator subtracts offensive rebounds from field-goal attempts, adds turnovers, and adds 0.44 times the number of free-throw attempts. This raw number is then scaled to 40 minutes. Scaling allows a direct comparison between one 10-minute quarter and the next. The tablet-over-scoreboard possession read that applies the 0.44 free-throw weight inside a 10-minute women's quarter provides an accurate measure of the game's true speed.
Pace dictates the flow of the matchup. A team forcing a faster pace might score more total points. Their points-per-possession efficiency might simultaneously drop. Winning the race up the floor only matters if the offensive execution remains sharp. Analysts typically set a comparison window between the first 10-minute quarter and the third 10-minute quarter after intermission. A significant fourth-quarter drop-off often flags underlying conditioning issues.
Live possession totals describe tempo; they do not register the minutes a short bench can hold that tempo through the fourth quarter. The mathematical pace remains constant on the screen. Physical fatigue inflicted by a high-possession game requires visual confirmation from the sidelines. The shot clock remains 30 seconds per live possession, providing a consistent baseline for these tempo calculations.
Optimizing the Possession Formula
Tracking these metrics in real-time requires discipline. The formula must be applied consistently across all four quarters. Relying solely on the raw score often masks a deteriorating offensive scheme. Teams that maintain their points-per-possession efficiency while increasing the overall pace demonstrate a proven ability to control the game's rhythm.
Isolating Physical Dominance on the Glass
Total rebounds mix uncontested team recoveries with fiercely contested boards. The share of available misses provides a much clearer picture of interior control. Each missed field goal creates exactly one available rebound. That rebound will either be an offensive board for the shooting team or a defensive board for the opponent. Tracking the percentage of these available misses secured by a team reveals their true effectiveness on the glass.
Early-season physical dominance is read directly from the offensive-rebound margin. Second-chance points serve as the primary catalyst for double-digit scoring runs. These sequences turn a tight two-possession game into a blowout. The second-chance points post on the put-back or the kick-out, occurring exactly one live possession after the initial miss.
Standard live feeds often collapse unnamed recoveries into a generic team-rebound line. Calculating individual rebounding rates requires the specific player tag found in the play-by-play data. Identifying which athletes consistently secure contested rebounds helps coaches evaluate their frontcourt rotations. A high offensive rebounding percentage guarantees extra possessions, placing immense pressure on the opposing defense.
Categorizing Turnovers and Transition Opportunities
Turnovers are split at the exact moment the defense can initiate a run. Dead-ball turnovers stop play entirely. The defense must inbound the ball in the half-court. Examples of dead-ball turnovers include traveling, an offensive foul, a five-second closely guarded violation, or the ball going out-of-bounds off the offense. These mistakes end a possession without immediately threatening the defense.
Live-ball turnovers keep the ball in play and create an immediate numbers advantage. A steal, an intercepted outlet pass, or a deflected pass that stays in bounds all fall into this category. Live-ball turnovers are disproportionately responsible for massive momentum shifts. They lead directly to high-percentage transition scoring opportunities. Understanding how official NCAA statisticians categorize turnovers helps analysts separate minor execution errors from catastrophic mistakes.
The 'Points Off Turnovers' stat line gauges defensive impact in real-time. This metric is checked on the comparison tab right after the transition make. The next shot-clock start still shows the shift in momentum. Teams that convert live-ball turnovers into immediate points dictate the terms of the matchup.
Reconstructing Lineups from Play-by-Play Data
Overall field-goal percentage lacks the necessary detail for deep analysis. Shooting splits separate points in the paint from perimeter jumpers. A quiet shooting night overall might still reveal absolute control of the paint or extreme variance from the three-point line. The paint versus perimeter split is taken directly from the points-in-the-paint line or the shot chart.

Lineups are rebuilt entirely from substitution rows in the play-by-play feed. Each five-player string is scored with a plus-minus rating until the next substitution occurs. The five-player net rating accumulates between these consecutive substitution events. Early-season multi-team events provide the optimal environment for coaches to test these specific combinations.
Rotation tests cluster heavily on the first two days of a multi-team event. Coaches deploy these experimental strings in the second and third quarters while the game remains inside a two-possession margin. The play-by-play data becomes a goldmine for identifying a team's most effective defensive unit. Tracking these specific five-player combinations yields actionable insights into a team's long-term strategy.
Structuring the Digital Workspace for Tip-Off
Monitoring these advanced metrics requires a specific digital setup. The workspace utilizes two separate panes. Rebound margin and turnover margin never require a tab switch during a crucial scoring run. The play-by-play feed supplies the specific player actions and the substitution data. The team comparison tab supplies the cumulative margins.
The refresh cycle is timed precisely to the media timeouts. The first dead ball at or under 5:00 of each quarter triggers this break. During this stoppage, the official feed typically flushes a batch of corrections. The under-5:00 media-timeout flush that updates rebound margin while leaving the weak-side switch unrecorded provides the most accurate snapshot of the game's current state. Overtime, if played, consists of a 5-minute period with its own specific under-5:00 dead-ball window.
Tip-off screen layout
- Open play-by-play in the left pane, locked to the current 10-minute quarter
- Open the team comparison tab in the right pane, scrolled to rebound margin and turnover margin
- Refresh both panes at the first dead ball at or under 5:00 of each quarter
Position your primary monitor with the play-by-play feed occupying the left half of the screen and the team comparison tab locked to the right half. Set your browser to automatically refresh the comparison tab at the 4:59 mark of the first quarter to capture the initial data flush.